Electricity Energy Burden Analysis
We are working for a day when all Kentuckians have access to affordable and efficient energy. A common way to measure energy affordability is to conduct an Energy Burden analysis which measures the percent of a household’s yearly income spent on energy, including electricity, transportation, and heating of the home. We conducted an analysis to start exploring energy affordability in Kentucky. Our study began by examining electricity energy burden, meaning it focuses on electricity bills and excludes other energy costs like transportation and heating a home. It describes how large a bite electricity bills take, on average, from an area’s median annual household income in Kentucky.

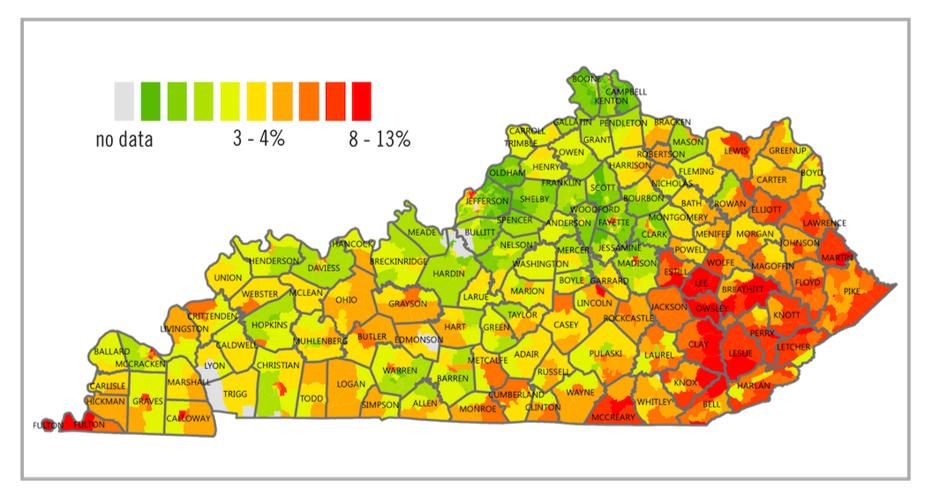
The map above visualizes results of our statewide analysis. Each census tract in Kentucky, where data was available, was assigned an electric utility, average yearly electric bill (2016), and average annual median household income (2016). Yearly electric bill was calculated a percent of annual household income. Communities across Kentucky experience electricity energy burden, ranging from 1 - 13% of yearly income.
Why this analysis is important
- Electricity energy burden is related to a lot of different issues: housing affordability, poverty, utility rates and structures, and availability of energy efficiency programs. These are issues that Kentuckians experiene across the state.
- Households experience high energy burdens are more likely to accumulate utility debt, inadequately heat or cool their home, and make tough decisions between paying for energy, rent, food, or medicine. We need to identify these communities and focus on solutions that help everyone, not just the utilities.
- Research shows that total energy costs are deemed unaffordable at 6%. For households in Kentucky where electricity bills alone are higher than 6% of income, this indicates severe overall energy burden.
- The analysis is limited to averages. Which makes it important to note that actual energy burden experienced by households will be higher than what's visualized on this map.
- We are using this analysis to support the energy efficiency Power House Workshops.
For details on methodology, data sources, and other resources, here's the technical documentation.
View results from this analysis as a layer on our web-based interactive Kentucky electric utility web map.
- Home
- |
- Sitemap
- |
- Get Involved
- |
- Privacy Policy
- |
- Press
- |
- About
- |
- Bill Tracker
- |
- Contact
- |
- Links
- |
- RSS

