![]()
![]()
![]()
![]()

Mapping environmental (in)justice in Kentucky
As KFTC members work to design a new, clean energy system for our state, we want principles of environmental justice and health equity to be at the front and center of our process and plan. Developing an Environmental Justice analysis is one important step we are taking to better understand which communities in our state are most affected by pollution, poor health, economic inequality and racial injustice.
“I see a day when all of us have equal access to conditions that make us healthy,” explained EJ workteam member Nancy Reinhart during a presentation this fall at the Empower Kentucky Summit. “Our families are worth it. Our kids are worth it. Our future is worth it. And we are going to get there.”
For the past six months, KFTC's Environmental Justice Workteam, made up of about a dozen volunteers from diverse backgrounds and regions of Kentucky, has been digging into data about health and pollution in our state. With the skillful help of a KFTC member and cartographer named Laura Greenfield, the team has produced a preliminary report and set of maps. As Laura pointed out in a workshop at the Summit, “Inequality is spatial. These types of maps can help us hone in on areas that over overburdened and see relationships between different factors that are impacting communities.”
Greenfield, who graduated from the University of Kentucky in May with a degree in Geography, stresses the importance of this type of analysis. “A clean energy movement needs to prioritize justice. This analysis is KFTC’s challenge to ourselves as an organization to do just that. It can help us answer two key questions: Where should resources and pollution reduction be directed, and do the most vulnerable communities in our state have a seat at the table in the decision-making process?”
The maps below are examples of several early products of the team’s work. They are described in much more detail in this preliminary report. KFTC’s EJ analysis is a work in progress. A final version of KFTC’s Economic and Environmental Justice Analysis will be issued as part of KFTC’s Empower Kentucky Plan in late winter/early spring of 2017.
This first image includes data for a dozen pollution indicators and six demographic factors, including race, poverty and unemployment. The areas that show up as red or orange have the highest intensity across all of the pollution and demographic indicators. Pollution factors examined include: proximity to active surface and deep coal mines, coal haul roads, and coal ash impoundments; measured levels of ozone, particulate matter, lead exposure; and proximity to permitted sites for hazardous waste disposal; waste disposal facilities, water pollution discharge sites, sites on the National Priorities List and sites with Risk Management Plans. This analysis will eventually be updated to include proximity to oil and gas drilling and additional factors.
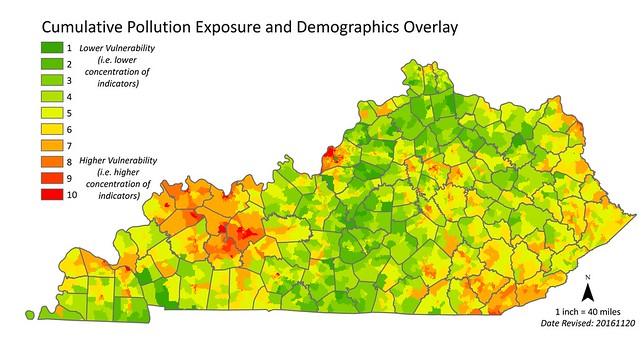
Click map to enlarge
A second map identifies communities with the highest combined score for health conditions that are associated with exposure to pollution. The health indicators examined include: rates of adult and childhood asthma, hypertension, heart-disease death, lung cancer, and premature death. Once again, the reddest areas of the map have the highest intensity across all health and demographic factors.
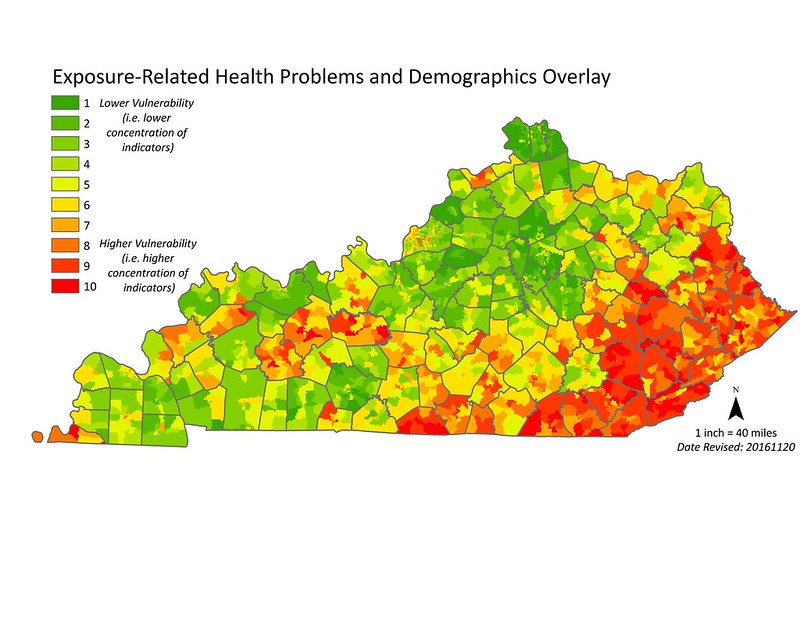
While these maps begin to tell an important story about how pollution and poor health is distributed across the state, they are also incomplete. Public feedback is welcome, and where possible, the team will continue to update these maps with additional data. In some cases, quantifiable data may not be available for important factors. For example, the health map does not include data on mental health, even though many people living in frontline communities experience poor mental health related to the stress of living in heavily polluted areas. In situations where good data is not available, our EJ analysis will seek to lift up stories and images that help tell a more complete story.
Eboni Cochran powerfully described that concern during a workshop at the Empower Kentucky Summit. As she explained, “In this work, when we talk about health, we most often talk about the physical health. But there’s an emotional and mental health cost too. When you come home from work and all you want to do is be with your family. And you get home and you smell this toxic odor that you know is dangerous. And all you want to do is take care of your family, and you’re trying to keep your kids safe. There’s a constant stress on our families.”
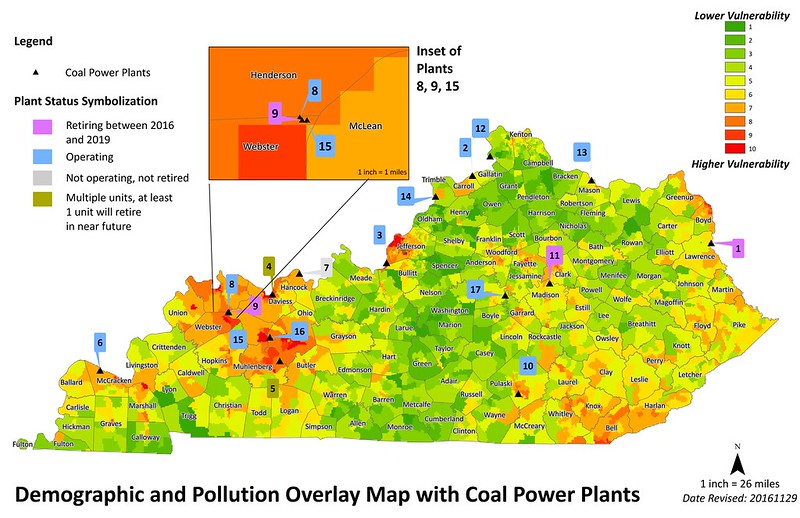
A third map pinpoints the location of Kentucky’s existing fleet of coal-fired power plants, most of which are located along the Ohio River on the western and northern spine of Kentucky. Once again, the read and orange areas are places with the combined scores of cumulative pollution and demographic factors, including poverty and race.
KFTC’s Environmental Justice Workteam began its work in June of 2016 as part of KFTC’s broader effort to shape a people’s energy plan for Kentucky. At the group’s first meeting, KFTC intern Ian Jaffe explained how the US EPA defines Environmental Justice. According to the agency, “Environmental justice is the fair treatment and meaningful involvement of all people regardless of race, color, national origin, or income, with respect to the development, implementation, and enforcement of environmental laws, regulations, and policies.”
The EPA’s Clean Power Plan strongly encourages, but does not require, states to do an Environmental Justice analysis to identify vulnerable communities (not defined) that are most affected by existing sources of pollution as part of each state’s planning process. The agency developed a tool, called EJ Screen, which provides lots of important data states or anyone else can use. But there is no single recipe or set of agreed upon steps for an EJ analysis. And the EPA’s tool doesn’t include some important state specific data, like the location of abandoned or active coal mines.
Back in June, KFTC’s EJ workteam developed their own set of goals for developing an analysis for Kentucky as part of the Empower Kentucky planning process. They agreed:
- We want to analyze a broad set of indicators to identify communities that should be prioritized as part of planning for a just transition to a clean energy economy in Kentucky.
- We want to develop an analysis that identifies communities where key demographic indicators (poverty, race, more) intersect with indicators in least three key areas: a) health and pollution exposure, b) energy sector job losses; and c) economic insecurity related to rising energy rates.
- The words we use to frame and describe our analysis matters. While the EPA uses the words “vulnerable communities,” we want to emphasize that – in many cases – these are communities that stand to benefit from a just transition.
- We intend to use our analysis to shape policies that minimize harm and direct benefits to identified priority communities. (Benefits might include reduced pollution, new jobs, support for ratepayers and workers, and direct investments in renewable energy and energy efficiency).
- We want to make our data publicly accessible and make the maps as interactive as possible.
- We will work to identify key research questions and indicators that should be considered by us, other stakeholder groups, the state, and the EPA as part of a broader EJ analysis. Given the complexity of this task and limited time and resources, we recognize that our initial analysis will be both meaningful and necessarily limited in scope.
A number of those goals and products are still under development, including additional maps that will show energy sector job losses and economic insecurity related to rising energy rates. Laura Greenfield will also help the team create an interactive web map that Kentuckians can use to examine the data. While that work continues, the team is pleased to share these initial maps and products as part of our effort to be transparent and invite public feedback. Questions and comments may be sent to [email protected].
In reflecting on what we’ve learned so far through this process, Laura Greenfield stressed the value of this type of information for shaping public understanding and decisions. She noted, “Cumulative pollution and health problems exist in both rural and urban areas of our state and are sourced from many different aspects of our energy and waste systems. It’s a complex issue and that makes it difficult to analyze. This preliminary work highlights those complexities, and there is still a long way to go. But the most important thing we can do is to share the complexities as we learn about them.”
Greenfield concluded, “We should state very loudly and clearly that there is environmental injustice in our state, that the people most affected (people of color, low income persons) have been aware and suffering for too long, and there are steps we are want our government to do about it.”
Issue Area(s):